Who Keeps Agtech’s Cutting Edge Sharp?
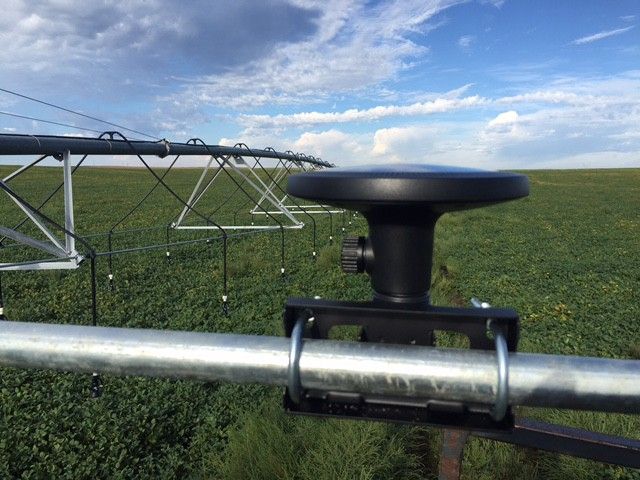
The Arable Mark collecting data on a center pivot.
Last month, I had a conversation with another CEO of a digital ag company about venture capital, mergers & acquisitions, and adoption rates in agriculture. The notion arose of how relatively little investment is devoted to ag compared to other sectors, with the familiar weary sense that this was an essential consequence of slow adoption cycles by farmers.
Heading home, I had to wonder: How much less venture investment is there in the ag sector? And is that really driven by slow on-farm adoption?
I’m just an agronomist (!) so I hadn’t spent a lot of time thinking about agtech as a vertical relative to other corners of the economy — but I have spent some time around the world. I lived a few years in the geographic center of Nowhere, Kazakhstan, where you see paper currency dating back years in age, no doubt still circulating slowly, reluctantly, and with deliberation in that village. I also spent a few years in San Francisco, where I’ve seen people literally throwing new bills at each other, sometimes in derision, other times up in the air in ecstasy. The ease with which people part with their money displays a sense of how likely they are to get it back. The conversation got me wondering, where on the map between Kazakhstan and San Francisco does agtech investment fall?
The Velocity of Tech Investment
Let’s take pen to paper to dig a little deeper. Defining a certain velocity as a rate (say, turnover per year) divided by a pool (say, total amount) will give us e-folding time (or, units 1/time). What is the velocity of the venture market in ag versus, say, the pharmaceutical industry?
We could slice this two ways: (1) from the perspective of the total dollar value of investment relative to the industry, or (2) to the total deal flow in the venture and M&A markets. Some statistics from 2016:
Ag: $1.9Bn / $3.4T (excluding food e-commerce) = 0.06%
Pharma: $9.2Bn / $1.2T = 0.9%
Relative velocity: pharma 15x agtech
By this measure, agriculture is a Soviet village, while pharma is San Francisco, cycling money an order of magnitude faster. Why are people throwing dollar bills at biotech? Let’s check out the M&A activity in 2016. What’s the likelihood of a return in life sciences instead of agtech?
Agtech: 2 exits / 580 deals = 0.0034
Pharma: 193 exits / 544 deals = 0.35
Relative velocity: pharma 100x agtech
Wow! Even though agriculture has more total deals than pharma and biotech, about a third of life science deals have some exit, whereas less than a hundredth of agtech companies have exits with some significant multiple. Perhaps some of that can be driven by the level of consolidation in the industry; whereas pharma has close to 200 players according to McKinsey, there are just four (or three, depending how you count) big seed and chemical companies in ag, and just six big equipment companies (of whom only Deere shows a big interest in technology).
Yet what people usually point to is the long, slow adoption cycle of technology by farmers. I’m not so sure.
A Tale of Two Farmers
The last month was a puzzler for those who study the tea leaves of agtech. Granular announced a big deal with Planet Labs. Sid Gorham, the CEO, had a great quote in Wired: “A lot of people assume that farmers are tech-averse. I would say they are tech-impatient.” By the end of the month, a different well-funded tech startup all but ran out of money, ostensibly from lack of traction for its imagery product.
My question here is: are farmers really slow adopters, or is that just a myth?
For at least twenty years, Purdue University and CropLife magazine have conducted a survey to dealers about their provision of precision ag services and the usage of these offerings by their customers. The earliest technologies considered were precision soil sampling and GPS yield monitors, and subsequently have encompassed satellite imagery and tractor chlorophyll mapping.
The adoption curve for technologies over time is generally modeled as a sigmoid curve that starts off exponential, and then diminishes as the market is saturated:
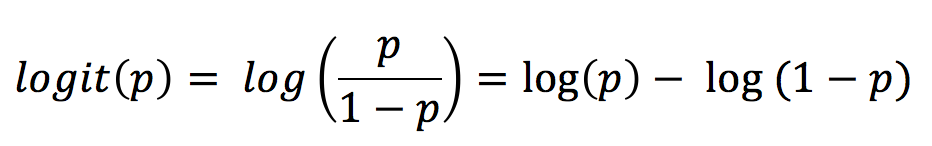
Logit(p) is generally plotted versus time to get a growth rate. When (p) is small, as it is for technologies early in their adoption cycle, the second term is small, and log(p) versus t is linear, which is the same as an exponential growth equation:

Let’s start with the adoption curve of satellite data, the only digital decision support system tracked by CropLife. Although satellite and airborne imaging has been around since the 1980s, CropLife tracked adoption in commercial ag beginning in 2003. Plotting log(p) versus t, we can fit a linear model, or a quadratic one that reflects the diminishing rate of adoption in recent surveys. Projecting that out, we see that dealer anticipation of satellite usage in 2018 is either pessimistic in the pure exponential case, or optimistic relative to flatting demand:
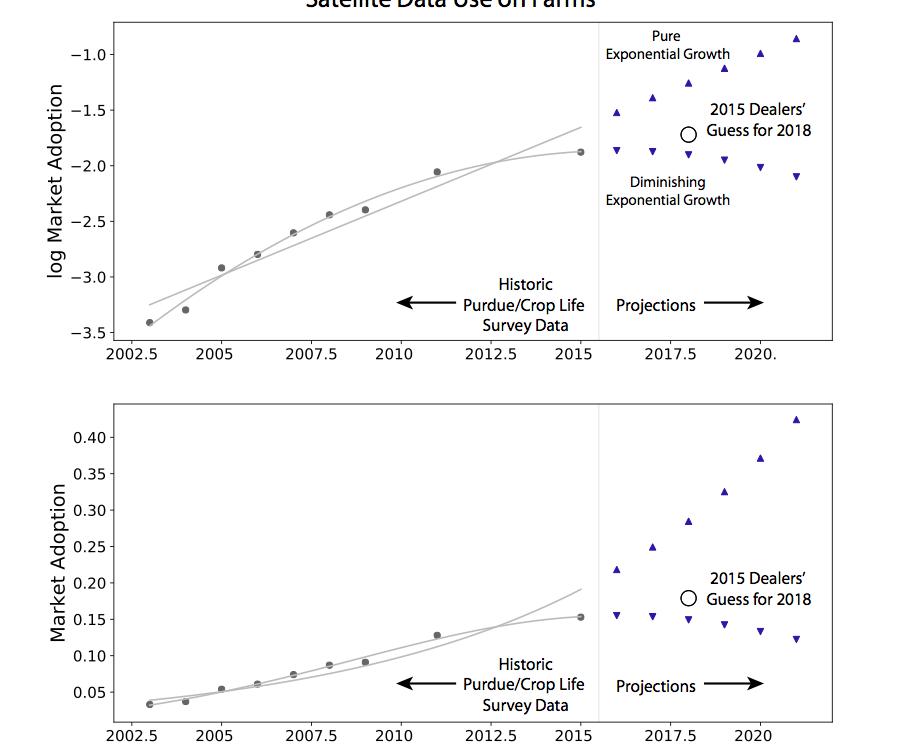
I suppose we’ll find out this year whether satellite data adoption is saturating at 20% or shows exponential growth!
The growth rate in the exponential case is 14.2%. Is that a high or low adoption rate? Let’s take a look at a century of general technology adoption curves collected by Asymco:
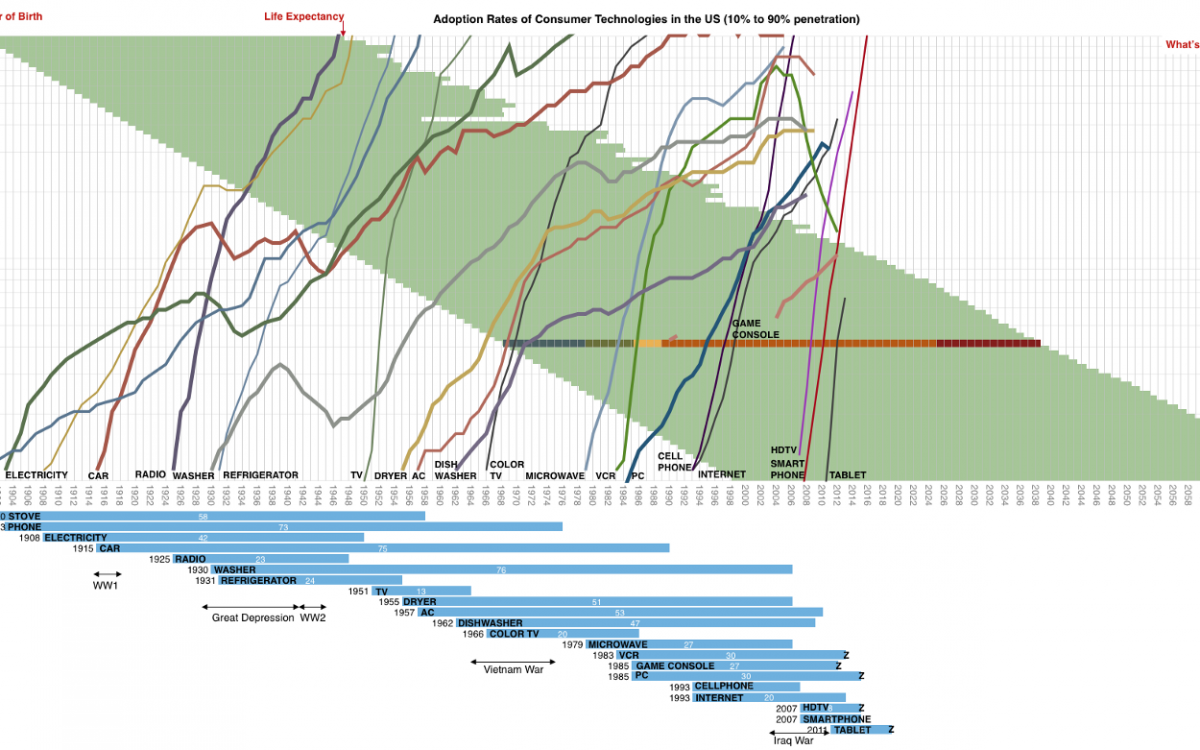
I used the CropLife 2015 survey data to situate (in green, below) the adoption rate of agricultural technologies — including herbicide-tolerant soybeans, the fastest adopted of transgenic seeds — among other familiar technologies of recent decades, from the graph above:

As it turns out, uptake of satellite data for decision support is in the middle of the pack, faster than the PC or Xbox, but slower than the internet or smartphones. GPS guidance in tractors is pretty far up there too!
The Bottom Line
The original question was whether agricultural innovation is stifled more by the dynamics of the investment and M&A market, or by tech adoption rates of farmers themselves. There really is no evidence that farmers limit innovation by slow rates of adoption. There’s no shortage of new tech entrepreneurship either; the number of early stage deals is large. Instead, the culprit seems to be the stagnant M&A market: high consolidation in the industry limits opportunities for investors, who have low patience for opportunities where they can’t earn a return.
On the other hand, there is lots of potential for growth if the trends continue as projected. If you look at the numbers, the explosion of connected devices in agriculture is faster than the smartphone, the fastest-adopted technology ever. A decade brought us from the flip phone to iPhone X. Where will we be in a decade with the Mark X? Since farmers are the ones who actually seem game to adopt new tech, we’ll keep betting on them to keep the cutting edge sharp.
Adam Wolf is the CEO of Arable.