Right as Rain

Rain figures into nearly every decision made in agriculture — the presence of it, the excess of it, the absence of it, the wetness that persists from it, the intense physical impact of it, the annoyance of working in it, the crop growth fueled by it, the fertilizer activated (or flushed) by it, the mud (or brick) that comes in its aftermath (or waiting too long for it). It’s no surprise then that the one technology you can count on every farmer using is a rain report — be it from Weather Underground or DTN or even phoning a friend to check their local wedge gauge. As a last resort: drive out yourself to see! (A shovel is a technology too)
When it comes to actually measuring the rain, though, it’s as true as ever that everybody talks about it but nobody does anything about it. What do I mean by that? Let’s take the Nebraska Mesonet, one of the more advanced networks in the world, which includes 67 stations. That’s about one 8” gauge every 3000 km2, or ten parts in a trillion to estimate the rain that falls in that area. That’s equivalent to estimating corn yield from less than one kernel per section. For something so central to decision making, and so impactful on the outcome, our ability to know what is happening out there is shockingly limited.
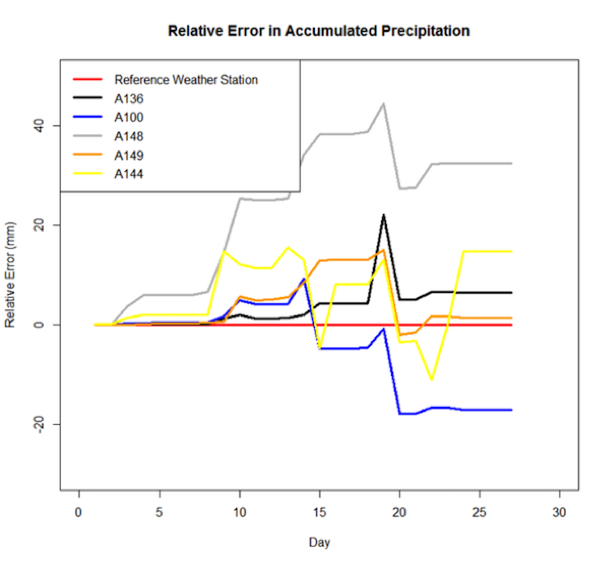
And it turns out that matters: In a small network of Marks in western Nebraska last summer, rainfall in a small region just 30 miles across gave variability not just 25% different in a day, but 40% different in a month! (And most of it at night when no one’s looking!)
I drive a lot, so I ask myself: How is it that we can know to the minute when we’ll arrive at our destination after an hour’s drive but not know something as basic as rainfall? The answer really comes down to the extreme variability of precipitation in time and space, along with the practical challenge of measurement. To measure is to know. In the case of rain, the challenge of measurement impedes our ability to know. Rainfall measurements must balance the wide extremes between drizzle and downpour, liquid rain and frozen hail, not to mention subtleties like wind blowing rain up and out of the gauge, rain coming down too hard for the bucket to keep up, sunlight evaporating fog and drizzle (more relevant for disease), leaves and bugs clogging the base of the funnel. It’s not hard to see why folks get so fed up with their tipping buckets even as they they have an insatiable desire for better rain data.
There are basically three types of rain gauges out there, the “tipping bucket” type that is familiar to most of us, the “accumulation” type that you can get down at the hardware store, and a grab bag of “drop-counting” types that strive to measure, surprise, individual drops. If you’ve used RainWise or Davis or Pessl, you’ve used a tipping bucket. It’s a funnel and as the funnel catches water, it routes it into a little seesaw that counts up how many times it has tipped. The main problem with these is they fill up with schmutz, they lose their calibration, they lose water from too little rain (evaporation), too much rain (tipper can’t keep up) and wind, which blows rain out due to the aerodynamics.
If you’ve used a wedge gauge, that is an accumulator. The National Weather Service actually relies on accumulation gauges, not digital, because they can be designed with no wind losses, some oil on top so they don’t evaporate, and they just fill up so there is no such thing as too heavy a downpour. Downside is that they are quite large. And manual! A person has to look at it and write it down. Various methods have been developed to allow for automation, including pressure transducers (wires that vibrate at a depth-dependent frequency), but these introduce as many errors as they solve.
Drop-counting rain gauges are quite interesting to us at Arable, not least because we have a couple of patents on them. But more relevant is that drop counters enable a link to the NEXRAD Doppler Radar Network. Radar backscatter is, oddly enough, proportional to drop diameter raised to the sixth power, times the number of such drops. Back in the 1940s a couple of university professors at McGill developed a relationship between the rain rate, the size, and the number of drops, which allowed for there to be a simple relationship between the radar signal and the rainfall. There’s some more details than that, but it remains a shortcoming of radar that it can’t really distinguish between a cloud with lots of small drops and a smaller amount of larger drops, which has immense consequences for estimating rainfall.
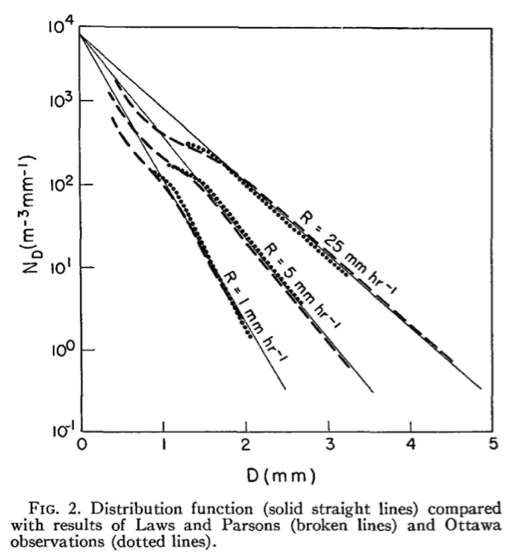
(Source)
Besides that, depending on where you live, the doppler station can be quite far away. Radar scanners are pointed in a slightly upward direction, to avoid the signal smashing into the ground. As a consequence, signals can be miles high at the periphery of the scanner — i.e., where most of the US is, once you leave radar hotspots like Illinois or the airline approaches to NY metropolitan area! A lot can happen to a falling drop in a mile or two; some rain may land on your field, and some rain may land in your neighbor’s field. Ask yourself: is this a map of rain, or is this a map of NEXRAD stations? If I were an ag-tech company relying on radar data to provide rainfall advice, I would focus on the I-states. But at Arable, we’ll focus on the rest.
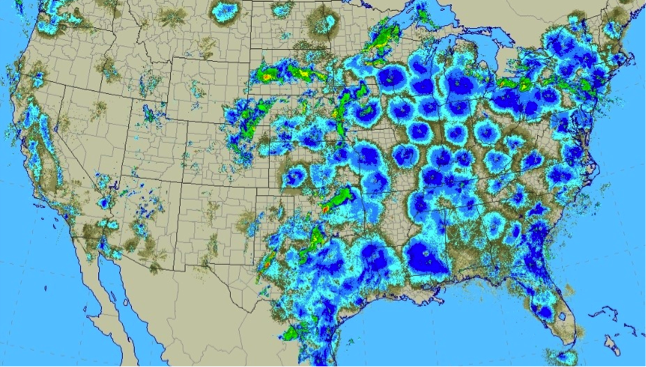
Another use for NEXRAD: “The blue circles reflect the density of flocks of birds, bats, or insects as they migrate over a radar station, allowing us to see nocturnal migration.”
While developing the Arable Mark, our approach in engineering its gauge was to avoid the pitfalls of the bucket and accumulation gauges — bulky, moving parts, accumulation of debris, insensitivity to small rain events, wind-sensitivity — yet also integrate its functionality with a lot of other measurements. So, the rain gauge is the same piece of plastic that has the GPS, the solar panel, the cellular connection, and in fact is the enclosure itself.
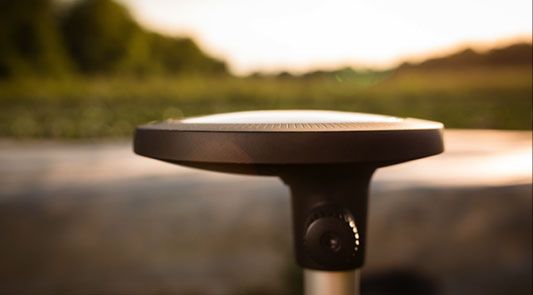
The Arable Mark
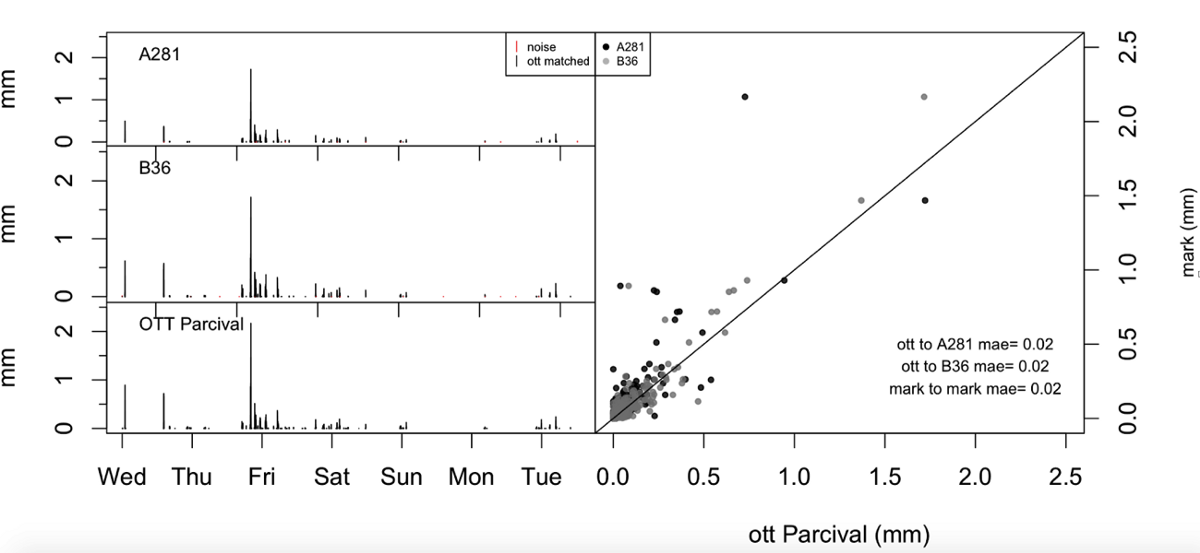
Calibration of Arable Mark against OTT Parsivel II laser disdrometer.
By bringing down the cost and complexity of measuring rain, Arable now has nearly the same density of stations in North Platte, NE as the entire Nebraska Mesonet. We have multiples-more stations in Northern California than CIMIS. And it matters! We are at a tipping point, so to speak, of precision agricultural weather availability. The texture of microclimates in different fields has only begun to be mapped, and Arable is just getting started filling in the blanks.
Adam Wolf is the CEO of Arable Labs, Inc.