A Guide to Measuring Evapotranspiration & Crop Coefficient
 Water and agriculture are inextricably linked. One agronomic variable that is key to successful crop production is evapotranspiration (ET). Ignoring this variable can impact crop quality and yields, especially during dry seasons and periods of water shortage. But when ET is measured and analyzed correctly, irrigation management plans can benefit in many ways. In this article, we will explore the use of ET and crop coefficient (KcNDVI), look at ways to measure these variables, and review some real-world examples.
What is Evapotranspiration?
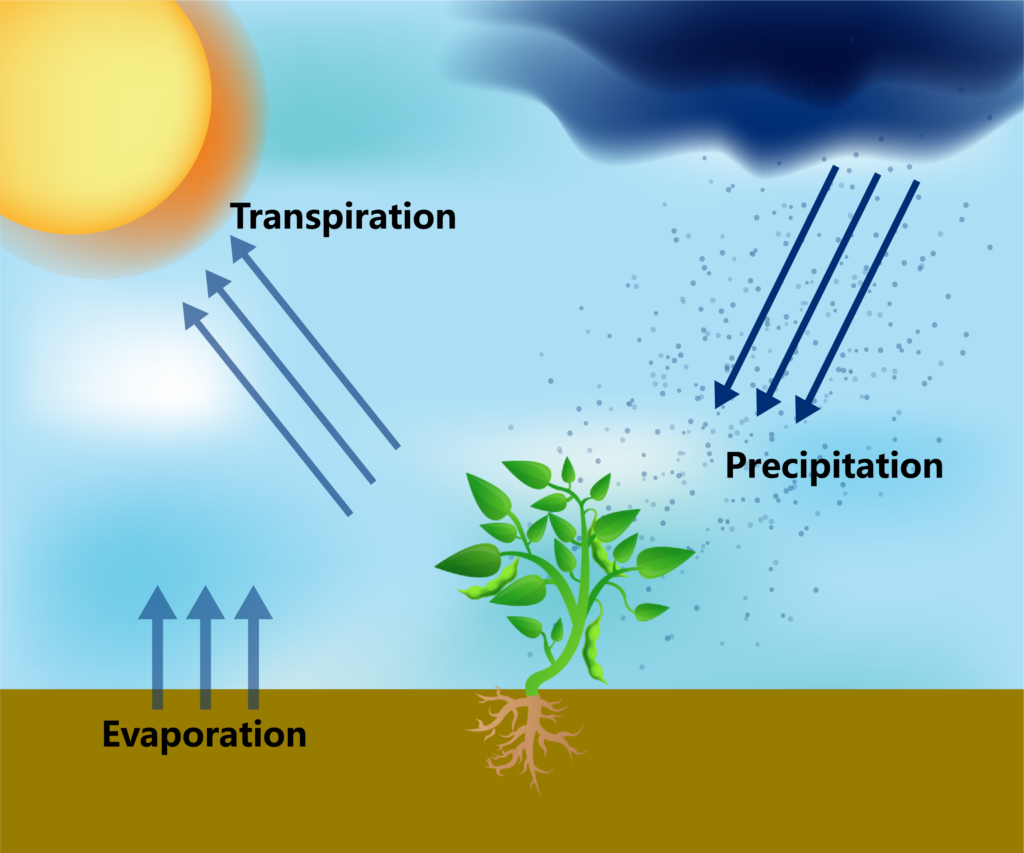
Evapotranspiration is the measurement of the amount of water a plant loses in a day. It is the combined loss of water from the processes of evaporation (the movement of water from surfaces or water bodies to the air) and transpiration (the loss of water vapor through the plant’s stomata to the atmosphere).
Since the actual amount of water lost through transpiration depends on the plant species and the plant’s growth stage, a more precise field measurement that takes the canopy cover into account is canopy evapotranspiration (ETc), which we will explore here.
Why Do We Measure Evapotranspiration?
The tendency to overwater a field is very common. However, this has many associated risks: disease inoculation, nutrient leaching, soil erosion, and reduction in quality in crops requiring a deficit irrigation strategy. Moreover, agricultural water use efficiency (WUE) is an increasingly important concept as droughts, the surge in atmospheric CO2, and denser plantings demand higher water intake, resulting in groundwater depletion.
By measuring ET and monitoring a field’s ETc, we can appropriately budget irrigation inputs based on our management plans, such as replacing only the water lost since the last irrigation or adding only what we can determine a plant needs at a given time. This is the most efficient and sustainable approach to irrigation management and is crucial to anyone who needs to comply with irrigation regulations such as California’s Sustainable Groundwater Management Act (SGMA).
In addition to irrigation management, other applications of evapotranspiration include plant stress monitoring and crop protection.
Measuring Evapotranspiration
Determining how much water a specific field is losing in real-time requires a broad set of weather and plant variables:
Crop Phenology and Growth Stage Measurement
- Normalized Difference Vegetation Index (NDVI)
- Air and canopy temperature (T)
- Crop coefficient (KcNDVI)
Environmental Conditions
- Relative humidity (RH)
- Saturated vapor pressure (esat)
- Actual vapor pressure (ea)
- Vapor pressure deficit (esat – ea)
- Net radiation (Rn)
- Precipitation (Precip)
- Wind speed (wind_speed)
The Arable approach includes a three-step process leveraging crop coefficient measurements.
- First, we derive the field evapotranspiration (ETf), which is akin to reference evapotranspiration (ETo) or the hypothetical evapotranspiration under a grass reference surface. ETf is a baseline (not species-specific) evapotranspiration rate based on your field’s actual weather conditions over a homogeneous area. Having in-field weather data is critical to calculating an accurate ETf value since it quantifies the evaporation power of the atmosphere. But using it for irrigation decisions is risky because the value can change based on crop characteristics and physiology.
- To get around this, we measure the Normalized Difference Vegetation Index (NDVI), which quantifies the health and stage of the crop’s growth in order to calculate the crop coefficient (KcNDVI) via the linear regression method developed by Kamble et al. NDVI is a measure of the “greenness” of a plant based on the canopy reflectance of light. The Kc depends on the species and changes throughout the growing season.
KcNDVI = 1.457 x NDVI – 0.1725 - Finally, we multiply your field’s ETf by your plants’ Kc to get an ETc value unique to the plants in your field. You can then use this value to devise a precise irrigation plan.
ETc = ETf x KcNDVI
Irrigation Management & Evapotranspiration Measurement Methods
As any grower knows, there are many different ways to approach irrigation management, and Arable offers a method that is unique in two ways.
First, Arable’s all-in-one device includes a suite of spectral sensors that calculate the plant’s NDVI to approximate crop growth over time. By not relying on pre-established KcNDVI tables, Arable is able to apply a dynamic crop coefficient (Kc) to its ET as the crop develops — an approach that incorporates a real-time understanding of exactly how the crop is growing to calculate KcNDVI as discussed above.
Second, Arable incorporates direct measurements from the field by calculating a hyperlocal ETf based on weather conditions around the Arable Mark instead of using a remote weather station. The Mark collects weather data including temperature, humidity, and solar radiation as well as wind, a key component of ET and a critical measurement that enables Arable to achieve 15% greater accuracy than using in-field weather data alone. This provides a more precise value of evapotranspiration that is highly representative of the conditions in your management area.
Other considerations about your irrigation system, such as soil type, field size, flow rate, and efficiency, will dictate the exact timing and amount of water that needs to be applied. By starting with CWD, you can ensure you are not over- or underestimating the amount of water needed to keep your plants healthy.
CWD = Precip – ETc
Example Use Cases
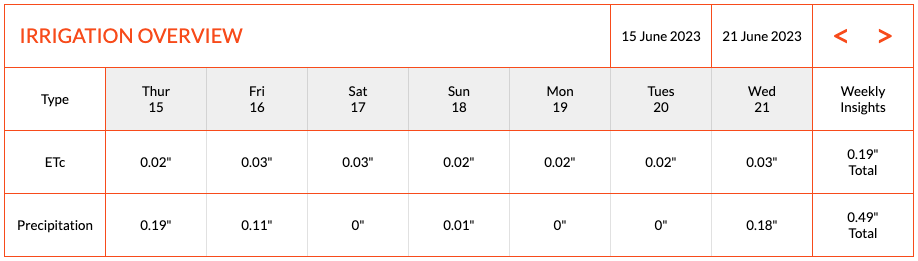
In the example shown below, a Mark in Australia reported a total input of 0.49” of rain over the past week. The same Mark reported an ETc of 0.19”. Since precipitation—the input—exceeds the amount of water lost to evapotranspiration, we know it is not necessary to irrigate at this time.
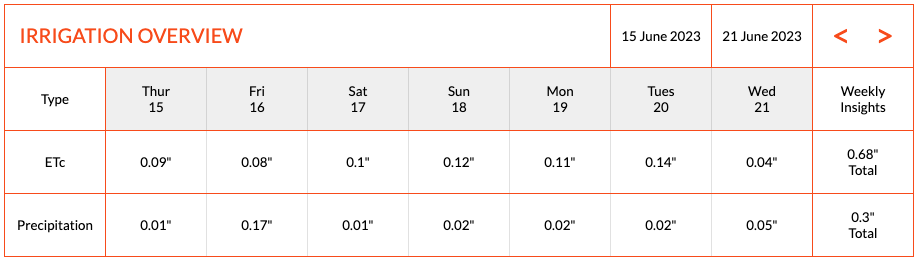
On the other hand, a field in California reported precipitation of 0.3” and an ETc of 0.68” for the same week. There is a deficit of -0.38” of water (CWD = 0.3” Precip – 0.68” ETc), which means that the field needs 0.38 acre-inches of irrigation to replenish the losses from that week.
Putting It Into Practice
Your next steps for irrigation management might include calculating in-system inefficiencies and determining accurate irrigation timing. These are based on your specific setups, such as your irrigation system, number of lines per row, and flow rate.
At Arable, we specialize in providing solutions that help harness data to drive sustainable and profitable outcomes. Armed with a rich, in-field climate and plant dataset, you can build an evidence-based management schedule that best enables you to define and achieve goals at each stage of the growing season.