When the Rain Didn’t Stop
As the busy 2018 hurricane season officially draws to a close, we wanted to share some insights from the Arable Mark device stationed at the USDA Institute for Pacific Islands Forestry Pacific Southwest Research Station in Hilo, Hawaii. The installation was funded through an SBIR Phase II grant to calibrate our patented acoustic disdrometer against other commercially available rain gauges in a scientific setting. We chose Hilo as a deployment site because it gets roughly 3.3m of rain per year (about 130”). With rain events almost daily, it is among the ideal planetary locations for rainfall testing due to an almost continuous flow of calibration targets.[1] After installing a Mark there in 2016, our device began operation in earnest.
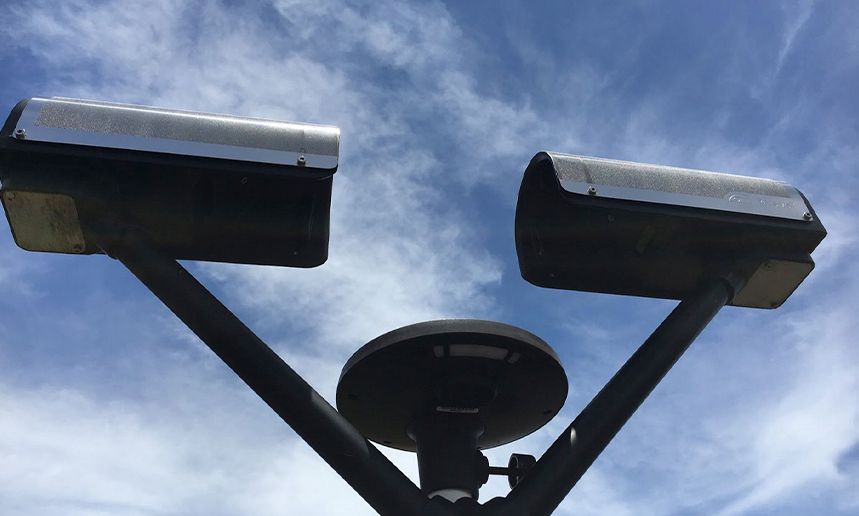
The Arable Mark nestled in the arms of the OTT Parsivel2 laser disdrometer for constant updating and perfecting our acoustic disdrometer calibrations.
What we did not anticipate was a hurricane passing by the island that would give us front-row seats to a catastrophic weather event as it unfolded. Our engineering, hardware, data science, and customer success teams collectively monitor all of our deployed devices for anomalies that may affect their performance, but our test devices like the one at Hilo tell us a different story. Calibrating against other gold-standard instruments at internationally recognized measurement sites helps us account for more subtle errors so we can continuously improve on our data quality. We have test locations across the United States, but the Hilo location has been our longest-running continuous installation. In late August, 2018, as Hawaii battened down to protect its residents and businesses from Hurricane Lane’s fury, we hoped for the best from our offices thousands of miles away.
This isn’t the first major storm event we’ve tracked through Arable Marks. Last year, one of our devices was deployed in northern Florida during Hurricane Irma’s barrage; although it was located inland and away from the hurricane center, the building on location was demolished by the storm. Despite the destruction, the Mark withstood the storm.
We were still unsure of what to expect with Hurricane Lane. The slow-moving cyclone did weaken as it approached the islands, but managed to dump an extraordinary amount of rain. We watched the sweeping of the rain bands over the weekend through the pressure drop normally associated with hurricanes and wind. This coincided with the most extraordinary rain event we’ve yet witnessed with Arable Marks. In three days we saw over 1500mm of rain in Hilo (nearly 5 feet!), and watched with concern as the state grappled with mudslides and flooding. We were relieved to hear our colleagues on the island weathered the storm without incident, and happy to see our test equipment remain active and online throughout the storms — no small feat.
Our Chief Data Scientist, Danielle Watts, explains some of the data gathered by the Mark and the laser disdrometer we’re calibrating against, below.
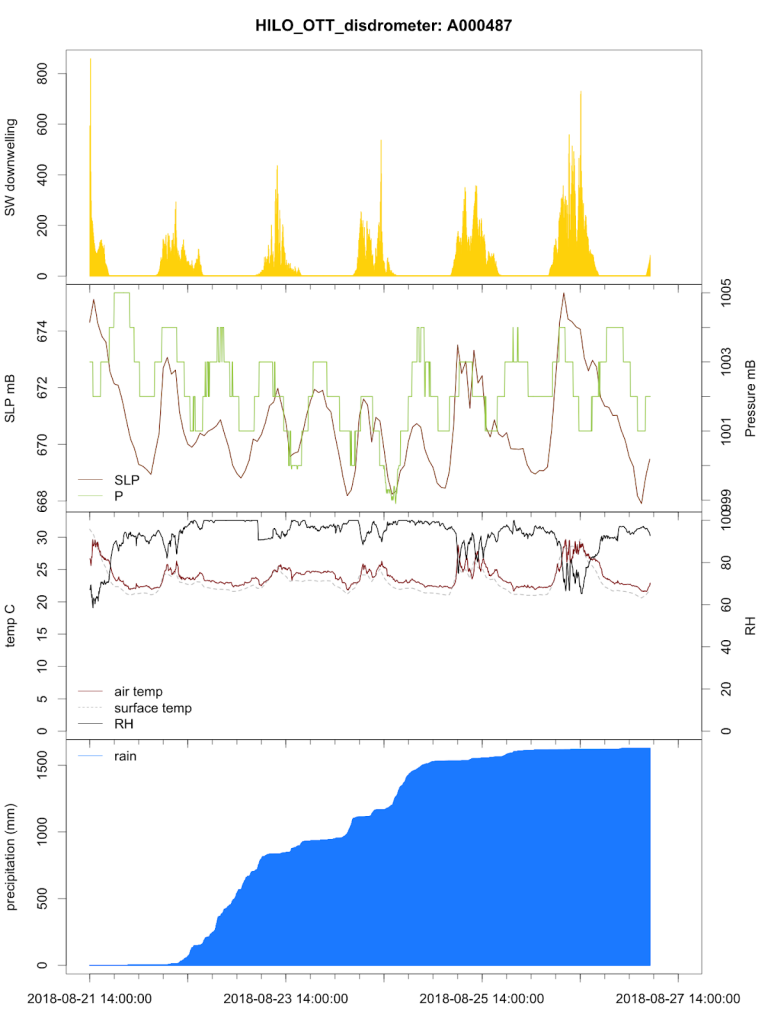
Top to bottom: Downwelling; atmospheric pressure; temperature/relative humidity; and total precipitation as measured by the Mark and the OTT Parsivel2 at Hilo.
The yellow peaks in the top figure depict downwelling short-wave energy, measured by a pyranometer on top of the device. The staccato valleys show the interruption of daytime light each time a storm band passed over (and, of course, nighttime in the wider troughs).
The second figure shows the atmospheric pressure and sea-level pressure during the event, measured in millibars. Large tropical storms are associated with drops in pressure; with hurricanes, we often see the dip in pressure each time one of the storm bands passes over, as shown here in correlation with the rise and fall of the downwelling radiation from the sun above.
The third figure shows temperatures and relative humidity. Warm sea surface temperatures contribute to hurricane development, and here you can see the warm, humid environment of the Hawaiian island. Hawaii gets relatively few hurricanes because of the cool ocean waters around it, but sea surface temperature models suggest that climate change will bring warmer surface temperatures and more hurricanes towards end of the century. According to El Niño watch, the sea surface temperatures around Hawaii are averaging warmer than usual right now.
The final figure above shows the total accumulated precipitation for the duration of the storm topped off at 1500mm as measured by the laser disdrometer. The hallmark of Hurricane Lane was its extraordinary rainfall; it turned out to be the wettest tropical cyclone on record in Hawaii, and our device was perfectly situated to record the storm-driven drops in pressure that came with the rain bands.
Precipitation is just one of the dozens of data streams we track, and we continue to individually calibrate the disparate instruments that make up our device. We strive for hyper-accurate specificity within our larger goal of value-added data synthesis in a way that makes the whole equal to the sum of its parts. In other words, we’re seeing both the forest and the trees — in this case, via the rain that falls on them. Our intent with test device installations is to build a solid baseline of data rooted in consistent, persistent calibration targets. From a purely empirical perspective, though, it was fortuitous for us to have such a dramatic rain event pass over a device situated solely to measure precipitation, and, as a data analytics company, really cool for us to be able to measure its output in real time.
Notes:
- We had been calibrating pyranometers against the Rutgers PAM site, a world-class station for radiometry, but weren’t getting rain events often enough to rapidly develop calibrations. Hilo is on the windward side of the big island of Hawaii, and when moist air hits the island and starts to rise in response to the big volcano, the moisture condenses and rain occurs. Despite some seasonality to rainfall on the island, there is at least a small amount of rain most days. Our other key rain test location is at the University of British Columbia in Vancouver, which has a lot of seasonal light rain, complementing the heavier rainfalls we see in Hilo.