A Guide to Chlorophyll Index: A Key Indicator of Plant Health
Chlorophyll is one of the most important pigments in photosynthesis, also serving as a key indicator of plant health. By measuring chlorophyll index, we can better understand how well plants are photosynthesizing and whether they are suffering from stressors like disease or environmental stress.
Some applications for measuring Chlorophyll Index include:
- Canopy nitrogen monitoring
- Crop physiology tracking
- Plant stress detection
- Senescence identification
- Fertilizer scheduling
Below, we’ll explore chlorophyll index in more detail, outline the measurement process, and look at an example use case.
What Is Chlorophyll Index?
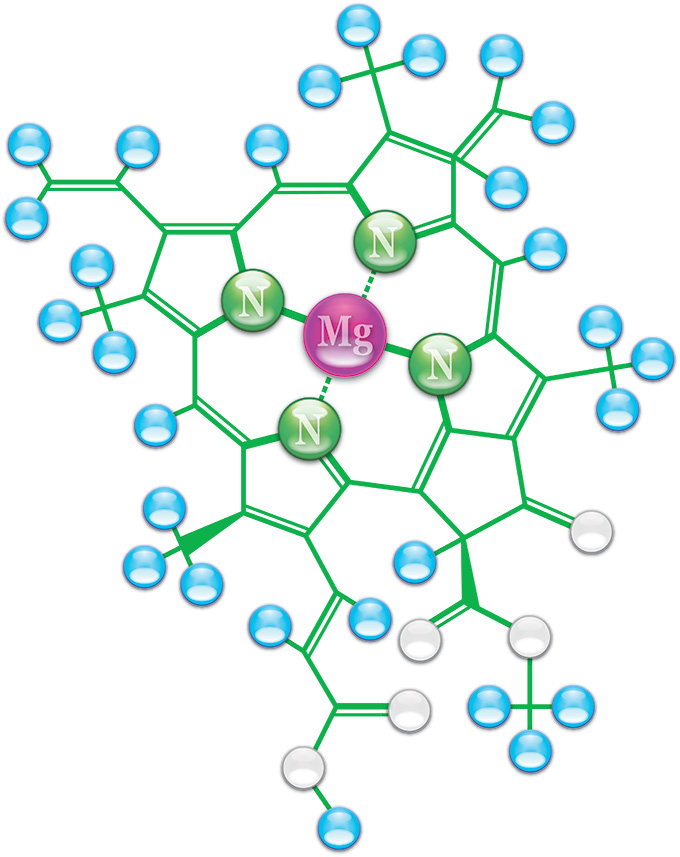
Chlorophyll Index (CI) is a relative indicator of the total chlorophyll content of leaves. Chlorophylls are green pigments that are essential for the first step in photosynthesis: capturing the energy from light. Chlorophylls harvest the solar radiation that will be further converted into chemical energy for the plant to use during the creation of organic carbohydrates.
Why Is Measuring Chlorophyll Index Important?
Chlorophyll Index is a non-destructive and highly sensitive method used to evaluate canopy nitrogen status. Nitrogen is essential for the production of amino acids, DNA, and other foundational molecules and tissues. Without sufficient amounts of nitrogen, plants cannot achieve their optimal bulk and size because nitrogen constitutes the center of the chlorophyll molecule. Therefore, assessing canopy nitrogen status throughout the season is a crucial part of monitoring your crop’s health and determining crop fertilizer requirements.
The density of chlorophyll also provides valuable information about the physiological state of a crop such as senescence, stress, and disease outbreak. In addition, leaf chlorophyll content is an important metric used to compare desirable traits in different phenotypes and varieties during breeding trials.
How Does Arable Measure Chlorophyll Index?
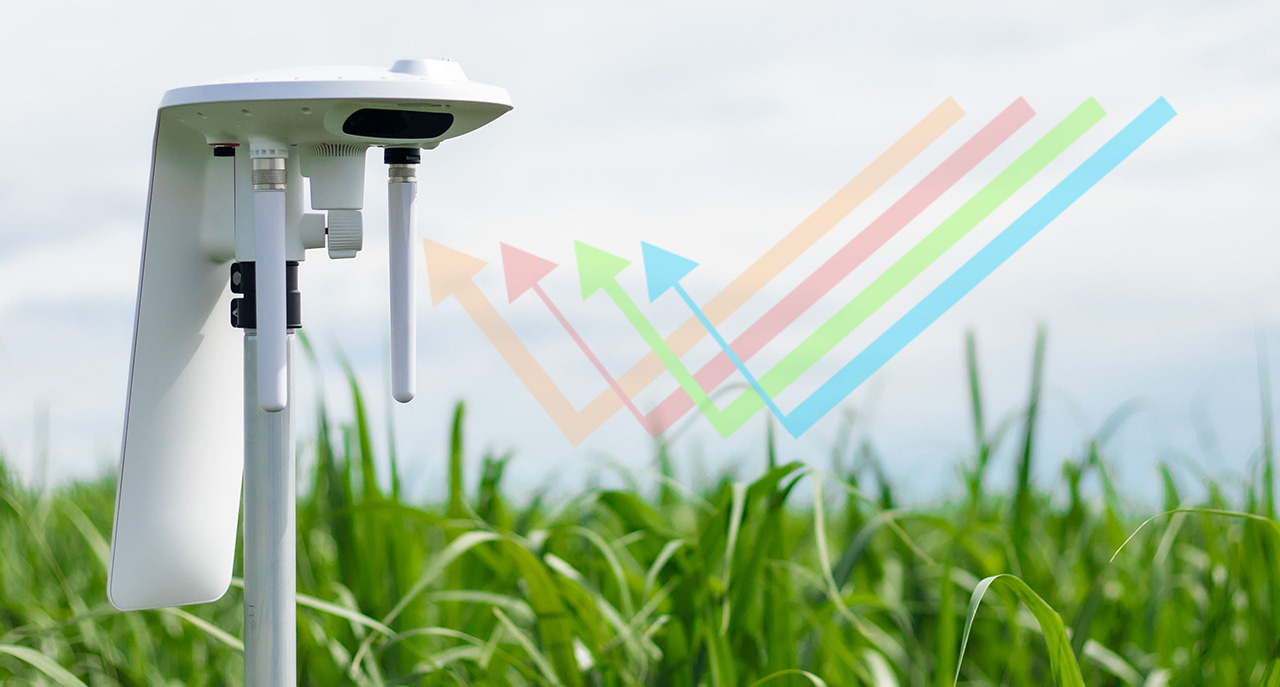
The Arable Mark features upward-facing and downward-facing spectrometers to measure the incoming and reflected radiation of specific ranges of light. These ranges of light, known as wavebands, are absorbed or reflected based on the amount of green canopy present under the spectrometer. Healthy, thicker, greener leaves (i.e., those with more chlorophyll) bounce away more radiation in the near-infrared spectrum, which is not visible to the human eye, to stay cool.
We first calculate the reflectance (ρ), which is the amount of light bouncing off the plant (or upwelling, measured by the downward-facing lens) divided by the amount of light in the atmosphere (or downwelling, measured by the upward-facing lens). For CI, we calculate the reflectances (ρ) of the green and near-infrared (NIR) wavelengths (λ).

How much of the green and NIR wavelengths are getting reflected back to the Mark?
The difference between the reciprocal reflectance of green and NIR bands linearly correlates to the total chlorophyll content and that is how we evaluate the overall quantity and vigor of green vegetation. A higher chlorophyll index is indicative of higher chlorophyll and nitrogen levels in the canopy and higher productivity in the plant.

What Does the Data Look Like?
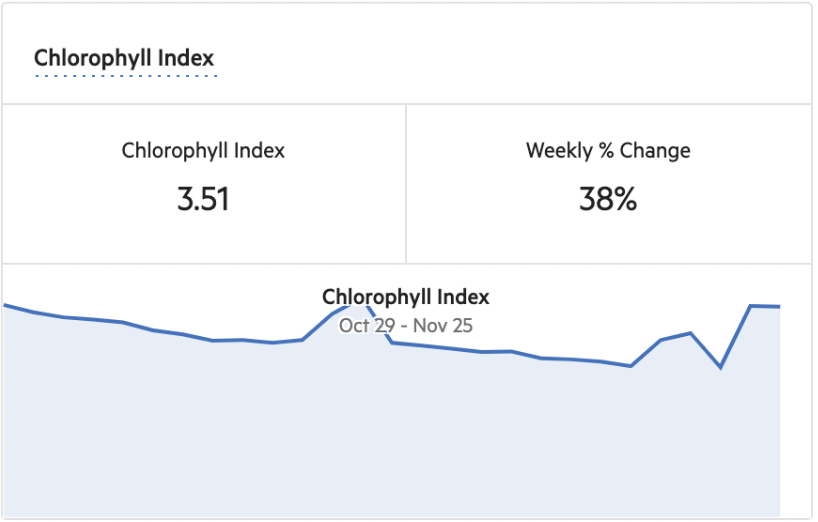
CI is a unitless measurement in an average range of 0 to 15. You can see the weekly change as a positive or negative percentage depending on the direction of change. Below is an example of a positive change over the last seven days in the CI. There is a relatively constant downward trend for a few days until the values pick up towards the end of the week. This change can be an indication of field management (such as nitrogen application) and the effects of crop nutrient uptake.
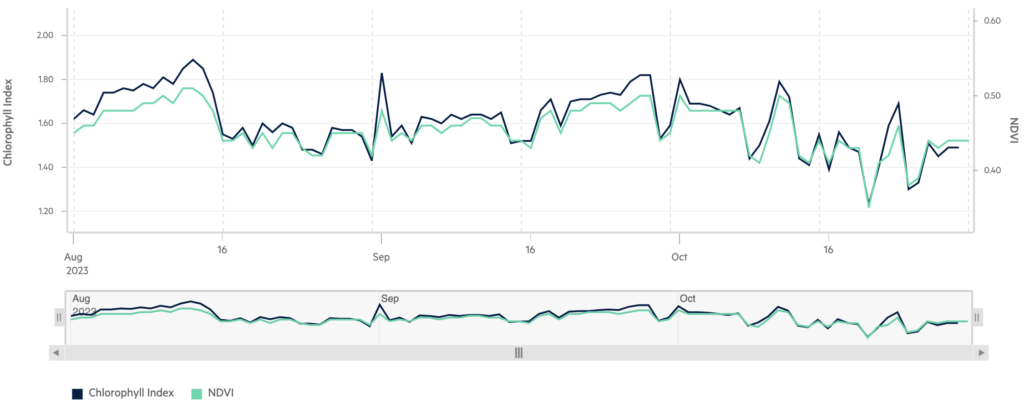
As the season progresses, you might be interested in tracking those changes in CI and comparing them to other measurements. Below is an example of a cornfield. While the values of NDVI saturate with canopy cover, CI shows a more dynamic range that can give you visibility into not just crop growth, but crop health. During the time when the crop is reaching the maximum canopy cover, the values of chlorophyll rise as the crop continues to intake nutrients necessary for the transition of the growth stage.
How to Use Chlorophyll Index Measurements
By monitoring CI values, you can keep track of plant growth and health. A decrease in the value could be an indicator that your crop requires a nutrient application. As the crop grows and develops other pigments in flowers and fruits during stages such as blooming, fruit ripening, and leaf senescence, the CI values will decrease. Sudden and unexpected changes in CI values could be an indication of crop stress or nitrogen deficiency.
CI status can also inform choices of fertilizer scheduling and efficiency. For example, it is often difficult to know if additional nitrogen fertilizer is needed throughout the season. Although it is common to err on the side of applying extra fertilizer, without confirmation that the plants are actually nitrogen-deficient or that they have taken up the nitrogen, you are at risk of wasting cost and resources to the surrounding environment. By becoming familiar with your crop’s CI values, you will be able to see when declines in CI values mean your plants are nitrogen-deficient. Moreover, by monitoring the CI after fertilizer applications, we can dynamically confirm nutrient uptake and fertilization use.
Example Use Cases
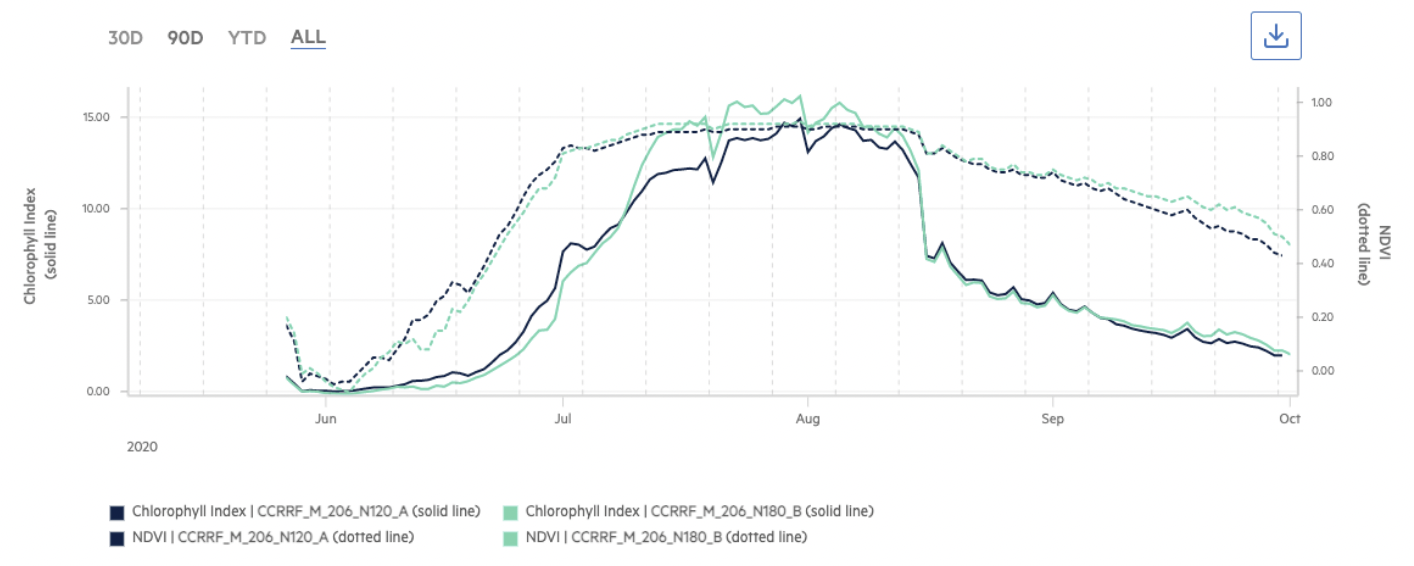
If applied nitrogen is being utilized by the plants, CI values will spike after fertilizer applications. Below is an example of two rice fields where we monitored the CI after different fertilizer application rates in early July. In comparison to NDVI, which indicates canopy development, the CI values show a later “final” spike after the nitrogen application. Most importantly, the field that received higher nitrogen input presented higher CI values. Note that the two major dips in the values (July 20, and August 1) coincide with very cloudy days, hence the drop in values for both metrics.
In Conclusion
Chlorophyll index is a key metric for understanding crop health and assessing nitrogen status, making it an important tool for growers and researchers alike. Data findings from chlorophyll index measurements can be used to improve crop yields, identify plant stressors, and compare different phenotypes and varieties.
At Arable, our innovative solutions can help you harness the power of this data to drive efficiency, sustainability, and confident decision-making. Learn more about our solutions here.