A Guide to Growing Degree Days (GDD): Linking Temperature and Crop Growth Stages
Growing degree days (GDD) is a key measurement for agricultural planning. Every time-sensitive crop intervention—crop protection and fertilizer applications, irrigation, harvest—has to be done at a specific plant growth stage to be most effective. Researchers have correlated GDD to crop growth stages for most species. Knowing the number of GDD that correspond to the crop growth stage of interest allows for accurate and efficient planning of production activities.
What are Growing Degree Days?
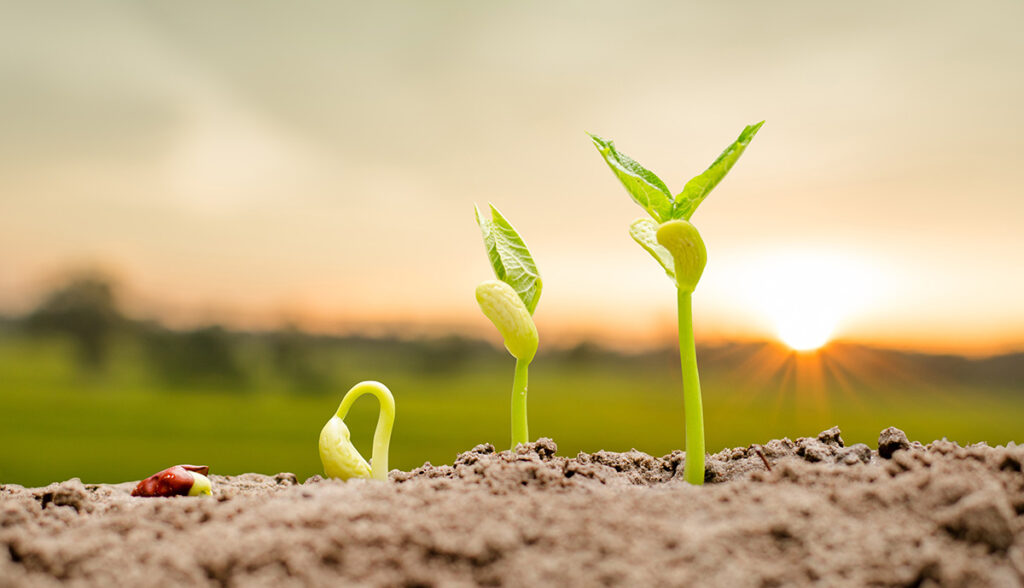
The rate of crop growth depends on the metabolic responses to temperature. Generally, higher temperatures correspond to higher development until some maximum temperature is reached, at which point the metabolism shuts down. In production agriculture, GDD, also called degree days or heat units, can be used to track plant development through stages from germination to maturity. It is used to compare the progress of plant growth between different locations and between different years. GDD are related to a plant’s physiological time in estimating the accumulated heat energy available to the plant over time.
Once a crop starts developing, or after winter in the case of specialty crops, the accumulation of GDD provides a clear indication of the stages the plant has reached (e.g. blooming, fruit development, harvest, senescence). The metabolic and physiological responses to temperatures differ between crops and cultivars, but the form generally applies to all species’ phenology.
Why are Growing Degree Days important to measure?
As temperature is a significant determinant of metabolic rate1, GDD is an accurate predictor of plant growth stage in healthy cropping systems2. Higher temperatures speed up plants’ metabolic rate in some processes, accelerating the production of the organic carbons, energy, and bulk they need to grow, causing them to mature more quickly. Since temperatures and climate conditions change from season to season, it is essential to know how rapidly a crop proceeds through its growth stages to anticipate the field needs.
GDD can also be a straightforward way to compare fields and growing seasons. The microclimate differences between fields (and even within fields) can strongly impact the growth rate. Monitoring the accumulating growing degree days across fields gives insight into the fields that are ready for harvest.
Practical Applications of Growing Degree Days
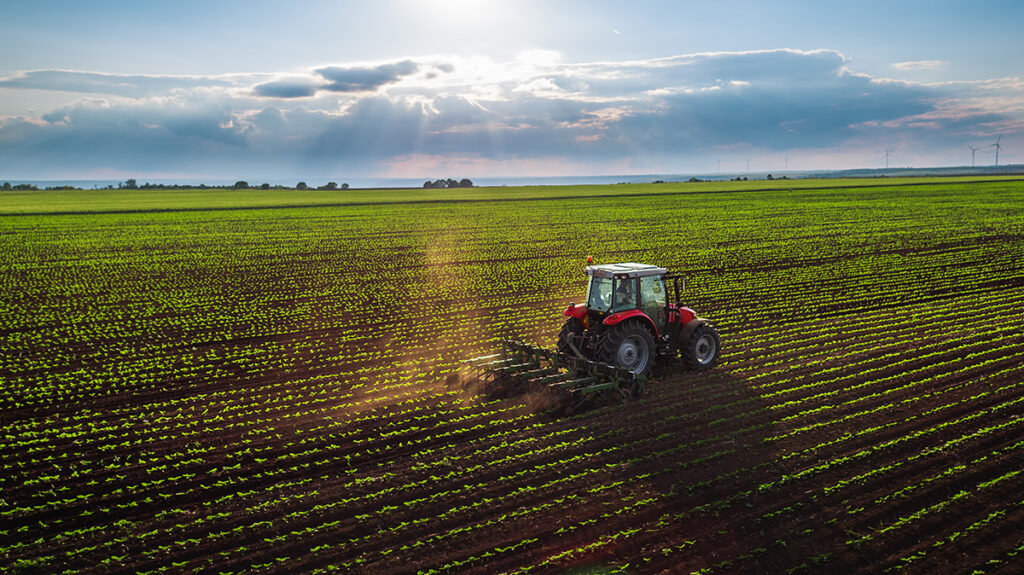
GDD is a scheduling tool that is used across the agricultural spectrum. In farming activities, uses include crop growth tracking, crop protection timing, disease risk identification, nutrient scheduling, and harvest prediction. In the area of research, GDD is used for breeding, varietal comparisons, field site evaluations, and plant stress monitoring.
Other applications of growing degree days include:
- Predicting plant growth and development: By measuring GDD, growers can predict when key developmental stages such as emergence, flowering, and maturity will occur. This information can help them schedule management practices such as planting, irrigation, and fertilizer applications at the optimal time.
- Comparing plant growth between locations: GDD can be used to compare the growth of plants in different locations. This information can be used to evaluate which locations are most suitable for a particular crop and identify factors limiting plant growth.
- Assessing the impact of weather conditions: GDD can be used to assess the impact of weather conditions on plant growth and development. For example, if GDD accumulation is lower than expected, it may indicate that the weather is too cool for optimal plant growth.
- Estimating crop yield: By tracking GDD, growers can estimate the potential yield of a crop. This information can help decide crop harvesting, storage, processing, and marketing.
- Improving crop management practices: By tracking GDD over time, growers can identify plant growth and development trends and adjust their management practices accordingly. For example, they may adjust irrigation or fertilizer applications based on the accumulated GDD and the developmental stage of the crop.
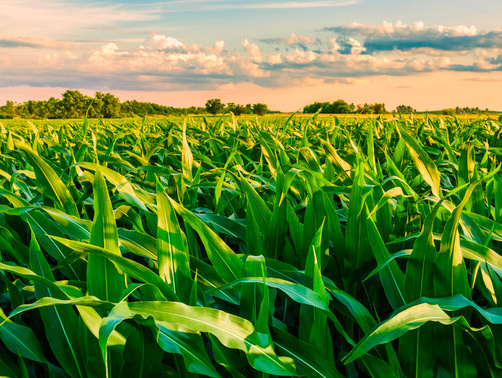
Why is the corn season 2-3 months longer in Iowa than in California?
A plant’s developmental stage is determined by physiological time, not chronological time. Physiological time is a function of temperature. This means that growing degree days determine how many calendar days it will take for a crop to go from seed to harvest. So in California’s Sacramento Valley, where there is near-constant solar radiation, the growing season for the same varieties will be much shorter than in places such as Iowa that have lower solar radiation.
How does Arable measure Growing Degree Days?
Arable maintains an extensive database of global crops and cultivars—which includes temperature thresholds as well as phenological stages modeled by researchers worldwide—for use in its web and mobile apps.3
Crop-specific GDD are calculated using the maximum temperature (Tmax) and the minimum temperature (Tmin), where Tmax and Tmin are the temperature thresholds set for each crop and variety.
Arable averages temperatures every hour and outputs the Tmin and Tmax for the corresponding hour. By subtracting Tmin from the average daily temperature, GDD captures only the heat that advances plant development. If the average daily temperature is less than the base temperature, then the GDD = 0.

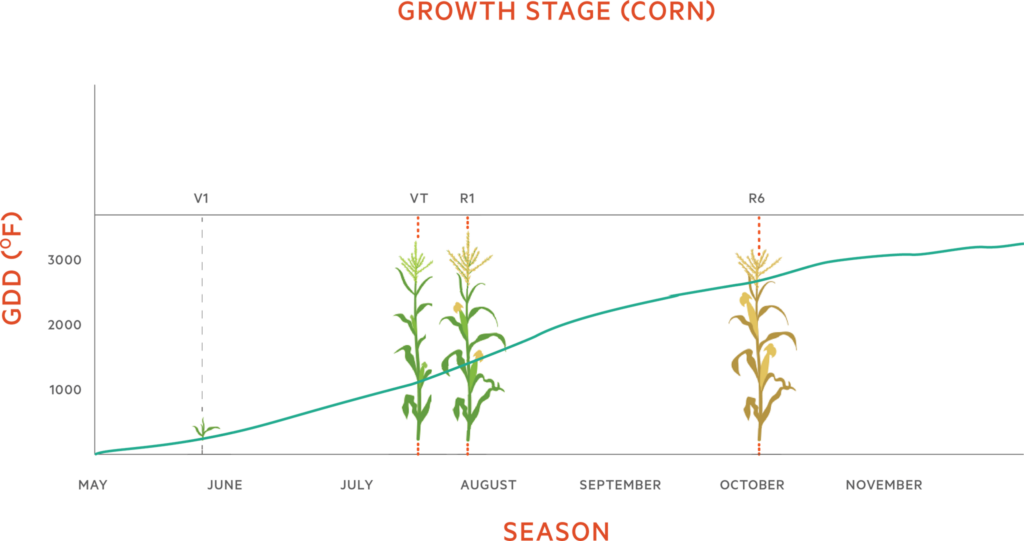
The sum of all the daily GDD values is added, resulting in the cumulative GDD. The calculated cumulative GDD for each crop can then be applied to its known growth stage.4
What does the GDD data look like in Arable’s system?
After selecting a crop and creating a corresponding growing season Arable’s platform, the crop’s growth stages and cumulative GDD are displayed.
Example use case
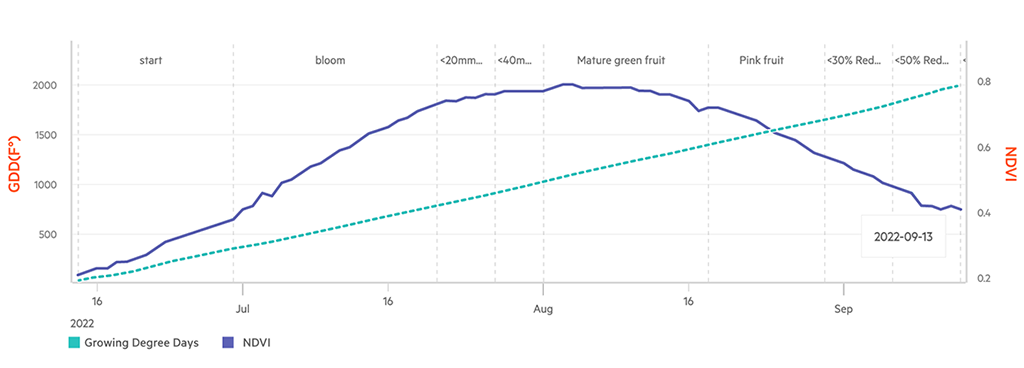
Changing management strategies based on GDD can influence the quality of the crop yield. For example, regulated deficit irrigation (RDI) has been shown to increase the soluble solids content (also known as Brix) of several crops, including tomatoes and grapes. When a plant is in a water deficit at the correct growth stage, the storage of carbohydrates in the fruit will increase. An increase in soluble solids can increase the sweetness or improve the texture of the fruit.
Arable has shown that the normalized difference vegetation index (NDVI), which measures the percentage of green canopy cover, is strongly correlated to cumulative GDD. By actively monitoring NDVI and GDD, irrigation can be reduced at precisely the correct time to increase the soluble solids content, thus increasing the fruit’s value.
Summary
GDD measure how much heat a crop has received during the season and, since temperature influences many biological processes that determine health and vigor, is heavily correlated to plant development. As such, accurately tracking GDD is key to effective crop management practices.
Arable’s agronomic modeling applies field-level temperature data collected by the Arable Mark to biological thresholds set for each crop and variety to capture only the heat that advances plant development.
To learn more about Arable’s state-of-the-art crop intelligence system, click here.
1 The metabolic rate is the amount of exogenous energy consumed per unit mass per unit time. Simply put, it is the amount of energy an organism needs to grow and stay alive. In plants, the source of this energy is the sun.
2 Healthy cropping systems are those with sufficient water, nutrients, light, and space that are undamaged by pests. Unhealthy cropping systems will have symptoms that obscure the detection of normal plant growth signals.
3 Additional crops and varietals can be added to the database by contacting Arable’s Customer Success team at support@arable.com.
4 For the most accurate results, the Mark should be set up and deployed the morning the fields are planted to capture the entire season’s daily temperatures.