A Guide to Normalized Difference Vegetation Index (NDVI)
A critical way to measure the success of your agricultural management practices is by using NDVI. NDVI, or Normalized Difference Vegetation Index, is an excellent tool for measuring the health and vigor of your crop and detecting subtle changes in plant health. Unexpected percent changes in NDVI can indicate problems in your crop, and expected changes can inform the implementation of essential management practices.
The many applications for NDVI include:
- Monitoring of canopy growth, crop phenology, and plant stress
- Growth stage predictions
- Irrigation scheduling
What is NDVI?
NDVI is a standard method used in precision agriculture to assess live green biomass; a higher NDVI indicates higher crop biomass. This measure is based on how the plant reflects and absorbs light at specific wavelengths. Healthy plants absorb more radiation in the red light spectrum and reflect more near-infrared radiation.
Why is Measuring NDVI Important?
An experienced agricultural professional develops a keen eye for changes in their plants. Visiting your field and getting a good look at the health and vigor of the plants—whether or not their size, shape, and color match what they should be at that moment in the season—is an essential part of making sure your crop will produce when and as needed. By measuring NDVI, we can differentiate soil from vegetation, identify stressed plants, and track crop growth over the season
This vegetative index is commonly used as both a crop status monitor and a decision-making tool. NDVI plots visually represent a plant’s canopy cover and growth cycle, allowing you to easily compare NDVI values between fields and seasons to ensure your crop is healthy and reaches the expected growth milestones.
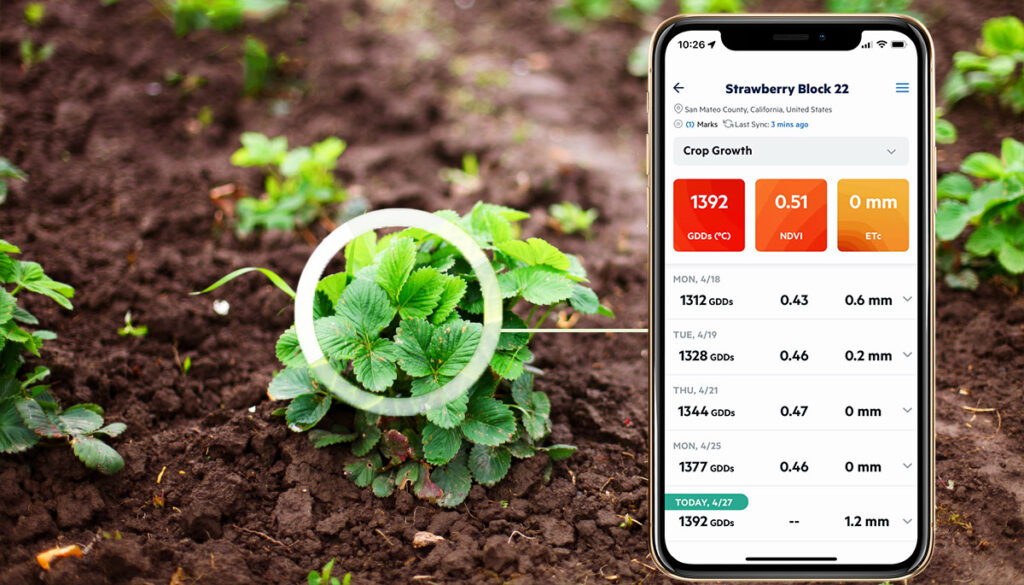
How Does Arable Measure NDVI?
The Arable Mark features an upward-facing and downward-facing spectrometer to measure the incoming and reflected radiation of specific spectrums of light. These ranges of light (wavebands) will be absorbed or reflected based on the amount of green canopy present under the spectrometer.
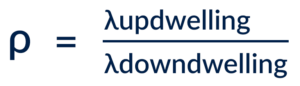
An index is a ratio or coefficient that demonstrates a relationship between related quantities. In the case of NDVI, it is a ratio of ratios. The first ratio we calculate is the reflectance (ρ), which is the amount of light that is leaving the plant (upwelling, measured by the downward-facing lens) divided by the amount of light entering the plant (down-welling, measurement by the upward-facing lens). For NDVI, we calculate the reflectance of the red and near-infrared (NIR) wavelengths (λ). This is how we know how much of the red and NIR light the plant pigments are “taking” and “rejecting.”
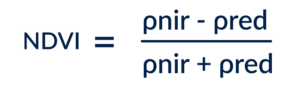
NDVI is then calculated as the ratio between the difference of NIR and red bands reflectance and the sum of reflectance from the same bands:
Arable also uses NDVI to provide localized, crop-specific canopy evapotranspiration (ETc) rates based on the crop coefficient (KcNDVI). KcNDVI is a multiplier that accounts for the plant’s leaf area and thus its evaporative demand—the more leaf area, the more water inputs it will require. We use the KcNDVI to convert a field’s evapotranspiration (ETf), based on climate conditions, to the crop-specific ETc.
What Does the Data Look Like?
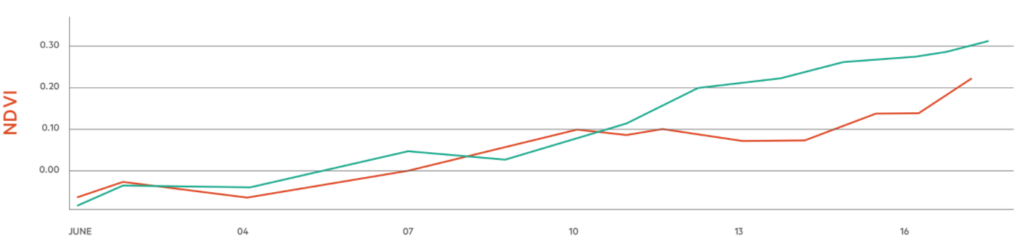
NDVI is a numeric measurement from -1 to 1, and you can see how the values increase as the canopy develops. Below is an example of two rice fields in California with two different fertilizer treatments. Both fields were planted simultaneously, but the crops with higher nitrogen input show higher NDVI values than those receiving less fertilizer.
How To Use NDVI
You should expect to see a reduction in NDVI values when the fields start looking less uniformly green or with signs of chlorosis*. NDVI should increase continuously until crop maturity, after which the values will decrease, indicating other phenological stages and canopy senescence**. An unexpected decrease in NDVI during canopy development could indicate plant stress, plant disease, nutrient deficiency, or canopy mismanagement.
Example Use Case: Regulated Deficit Irrigation (RDI)
Since NDVI values provide granular insights into your crop phenology and canopy vigor, they can also be used to time the implementation of complex management practices. You can picture the increase of the NDVI curve as the canopy development, and when the plant starts producing fruits, the curve will reach the maximum values before the start of a slow decrease driven by fruit ripening.
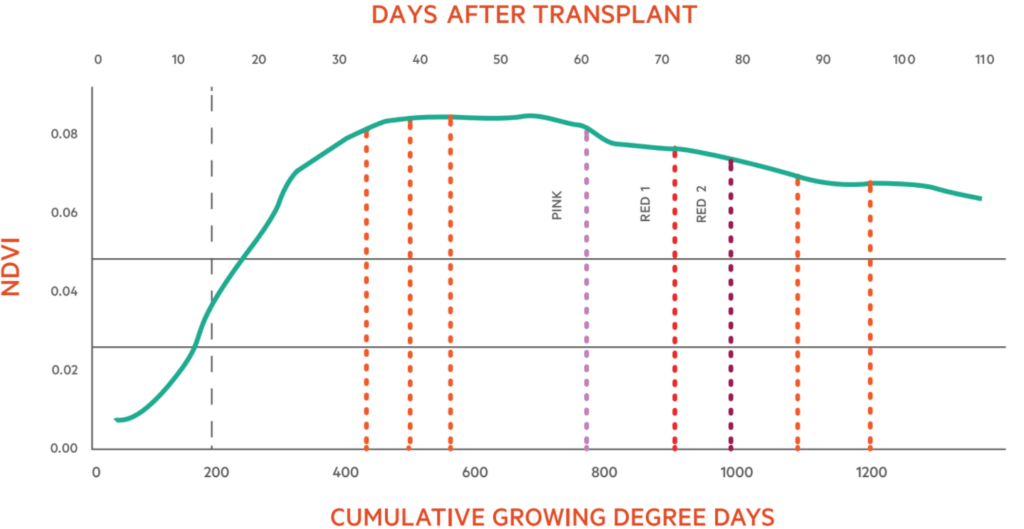
NDVI can help determine the optimal time to begin deficit irrigation in tomatoes. Several studies indicate that beginning deficit irrigation at the pink fruit stage can maintain or even increase yield. Since NDVI is a critical factor in determining the start date for regulated deficit irrigation (RDI), it is vital to keep track of it as the pink fruit growth stage approaches. A small negative percentage change within the NDVI range for subsequent days means you are most likely seeing the change in color of your crops as the fruit ripens. Aligned with growing degree days (GDD), a direct indicator of crop development, an NDVI change indicates that it’s time to implement RDI.
Wrapping Up
NDVI is a significant indicator of crop health and vitality. Even small changes in NDVI can indicate impending problems for your crops, so it’s essential to pay attention when this number begins trending up or down; these alerts might suggest that something needs attention.
At Arable, we’re here to help you make your agricultural practices as successful as possible. Our data solutions help you harness the power of your information for sustainable profitability.
Click here to learn more about how Arable can help you harness the power of your in-field data.
—
*Chlorosis is the loss of chlorophyll in a plant that presents as a lightening of green or yellowing leaf tissues. Since the nitrogen and chlorophyll content are tightly linked, it is also synonymous with nitrogen deficiency.
**Senescence is the process of aging due to stressors or the appropriate passage of time.