Get to Know: Location Deep Dive with Arable’s Advanced Analytics
We’ve been hunkered down at Arable Remote HQ lately, working hard to develop some new weather and crop metrics for our beta release of Advanced Analytics in Arable Web, and they’re here! Our customers told us how important it is to have more ways to see data and understand how seasonal conditions impact crop outcomes, and we’ve made it easier than ever to get the most useful agronomic data out there.
Introducing: Location Deep Dive
We recently published new crop growth dashboards on Arable Mobile (Android / iOS). This week we are releasing our first version for Arable Web, Location Deep Dive, which drills into season-long growth metrics at any one of an organization’s deployed locations.
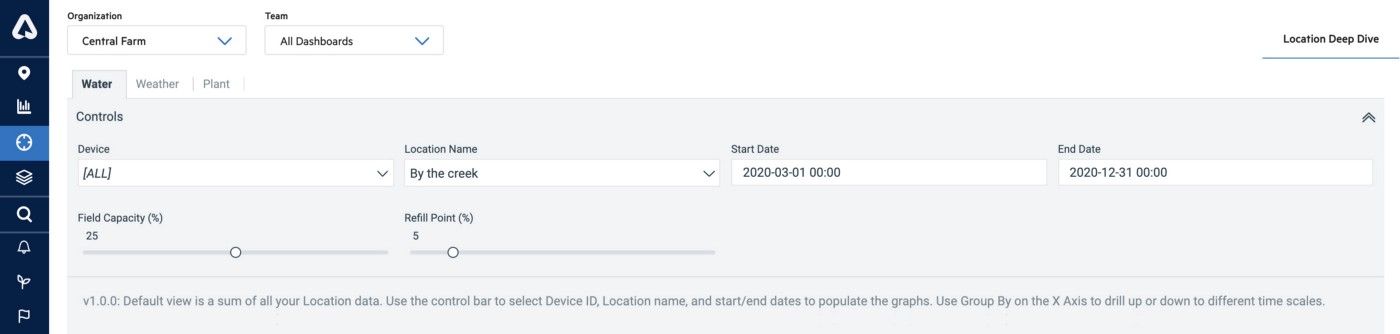
In Arable Web, click on the Advanced Analytics section of the left-hand navigation bar to see three tabs: Water, Weather, and Plant. Select one of these tabs, choose a device number or a location, specify the date range and start exploring!
Get Full Visibility at Any Location
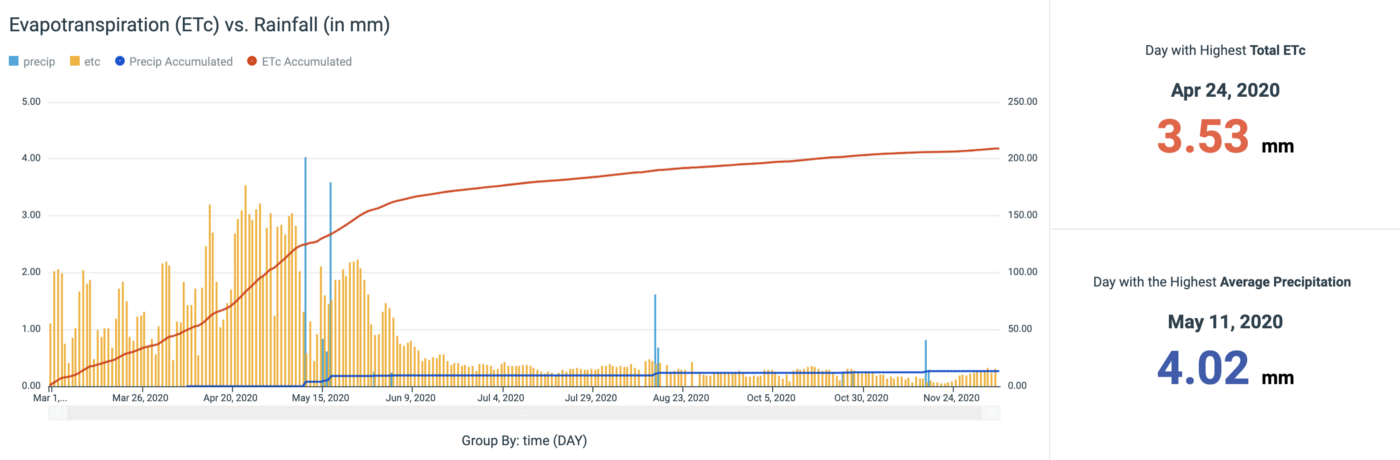
On the Water tab, you’ll see the history of water coming in and going out of a location over the course of your season, to help you understand how water flows there, what you may need to manage, and when to do so. Graphs on this tab include precipitation in the context of ETc, crop water balance, and soil moisture (if you have a connected probe).
The Weather tab displays your site’s microclimate over the course of the season, with deeper insights into what factors influence outcomes. Graphs on this tab show rainfall amounts; temperature fluctuations, anomalies & extremes; vapor pressure deficit & stress days; and sunshine duration & accumulation.
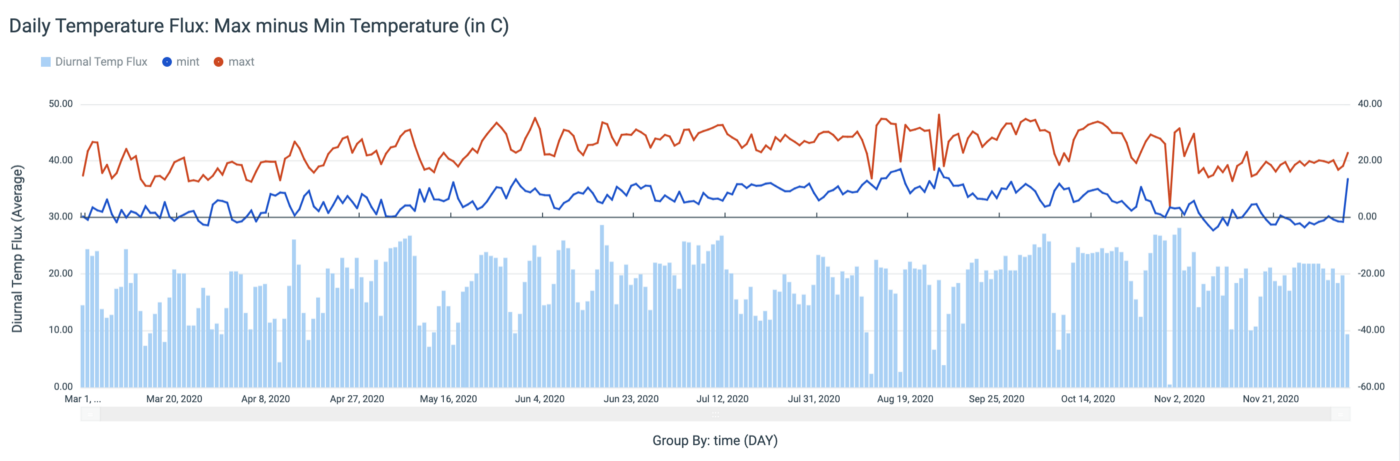
Diurnal temperature flux from the Weather tab.
And the Plant tab shows how your crop grew and responded to your management practices given the environmental context at your site. You can use this information to adjust your plans, and see new connections between decisions and outcomes. Graphs on this tab include daily NDVI, cumulative GDDs against NDVI (if you have specified a season), sunshine duration, and a tailored seasonal growth overview that uses the seasons you specified in the Web app.
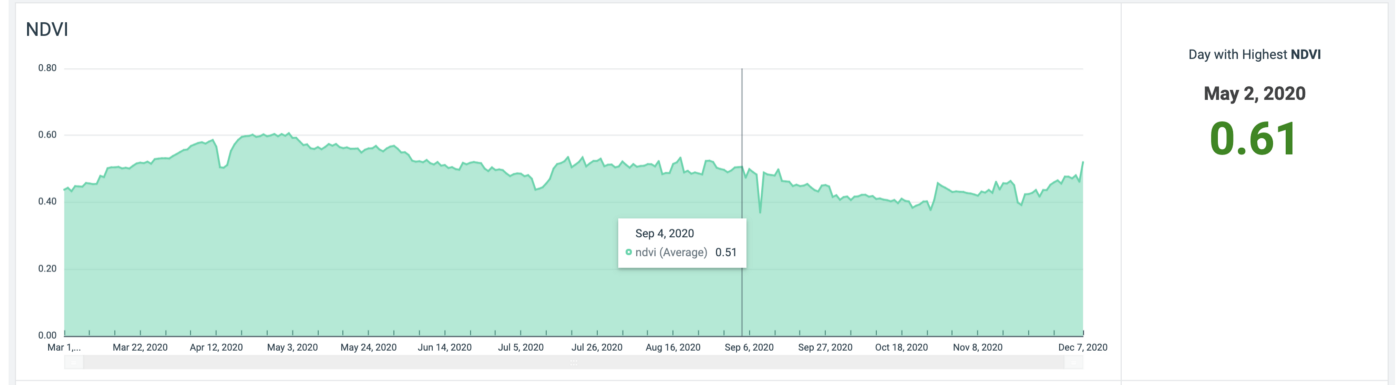
Daily NDVI on the Plant tab.
New Analysis Tools
These insights provide more than just ways to visualize your data. They also forge new pathways to idea-sparking and decision-making, including:
- Multi-data point visualization: Compare ETc, Rainfall, and VPD in one chart to understand the complex ways water impacts yield and quality.
- Easy export and sharing: All visualizations can be easily exported to a spreadsheet and shared with other users.
- Daily, weekly and monthly summaries: Rainfall and other variables are summarized by day, week and month to allow for easier assessment of seasonal patterns. To see these, right-click on the graph at the point in the time series you want to view:
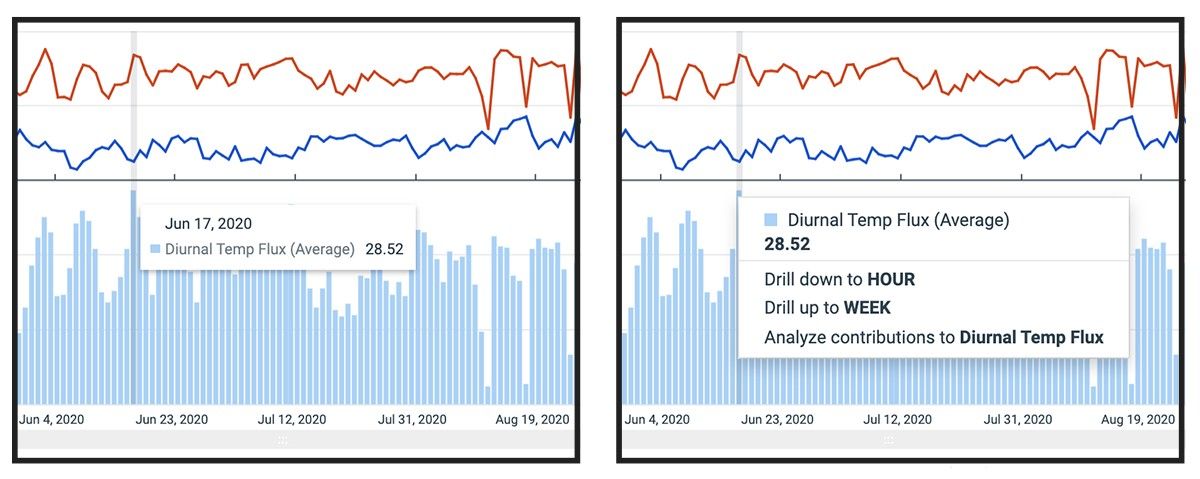
Graphs in Location Deep Dive allow you to view data in daily, weekly, and monthly timescales by right-clicking on a date and selecting your choice.
New Temperature Indices
We are also including some new threshold definitions:
- Heat Stress Days: Max temp over 36C (96F)
- Freeze Days: Min temp below 2C (36F)
- Warm Nights: Min temp above 22C (72F)
- Cool Days: Max temp below 18C (64F)
- Diurnal Temp Flux: Daily difference between max & min temps
- Good Sunlight Days: Sunlight hours 11 or more
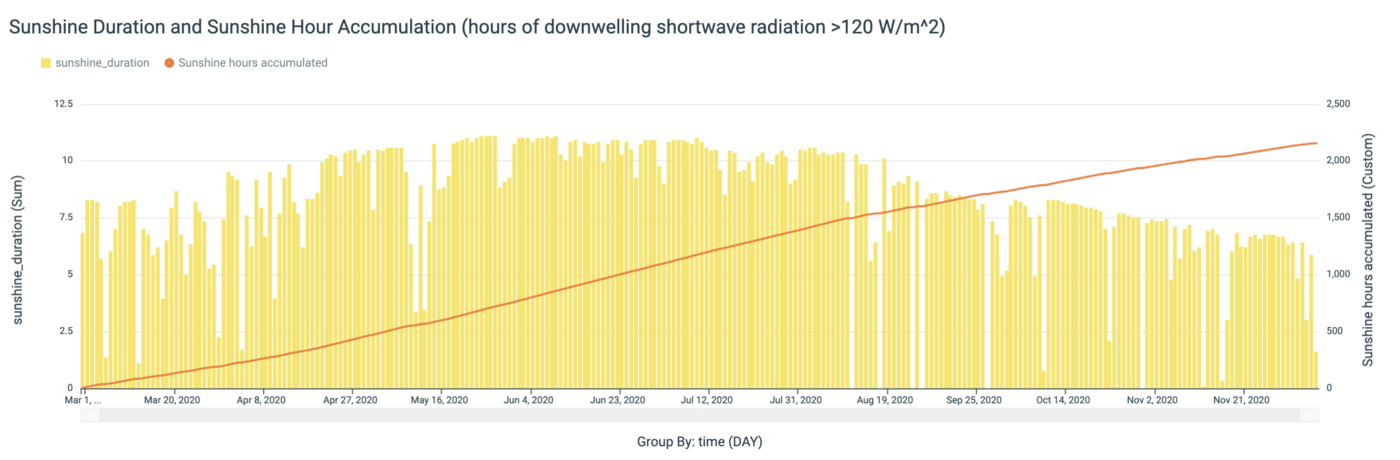
Sunny days inform growth patterns and can also correlate to stress and disease pressure.
This is Just the Beginning
Location Deep Dive is packed with new insights. We’ll continue to iterate on them in the coming months, and hope they plant the seeds to imagine possibilities beyond what you see here. We strive to make our data useful, and think that these analysis tools will make your job that much easier. We developed them with customers who reached out to us asking for more insights, analysis, and ways to think about their data, and we’d love to work with you, too.
For more on Arable’s features, partnerships, and initiatives, visit our blog.